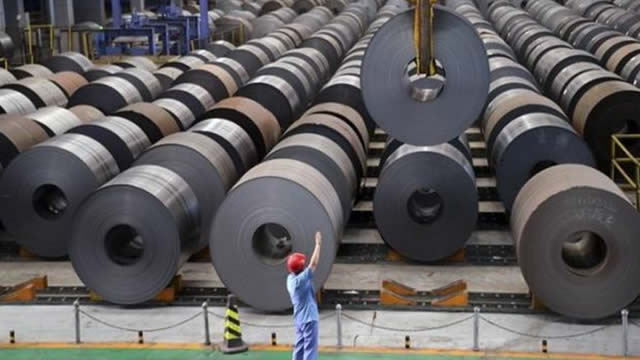
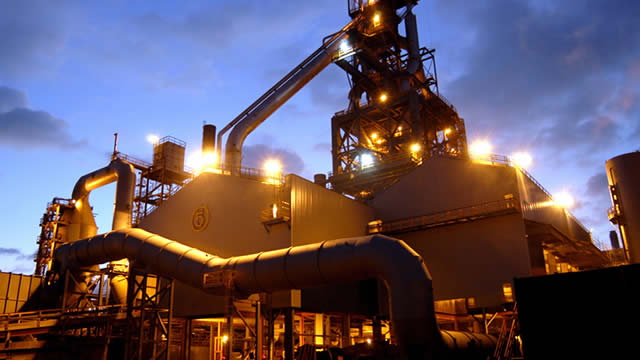
Reliance, Inc. (RS) Q4 2025 Earnings Call Transcript
RS • NYSE
Unlock comprehensive alternative data signals to make better investment decisions

Track website visits, page views, unique visitors, and engagement metrics over time to gauge online interest and brand strength.

Monitor Twitter follower growth, engagement rates, and social media presence to understand brand reach and community sentiment.

Analyze TikTok follower trends and viral content performance to measure youth demographic appeal and cultural relevance.

Track Facebook page likes, comments, shares, and post engagement to assess community interaction and brand loyalty.

Monitor Instagram follower growth, engagement rates, and visual content performance across demographics.

Track YouTube channel growth, video views, and subscriber engagement to measure content marketing effectiveness.

Monitor LinkedIn company page followers and professional network growth to assess B2B brand strength and talent attraction.

Track open job positions and hiring trends as a leading indicator of company expansion, contraction, or strategic shifts.

Monitor employee headcount changes on LinkedIn to gauge organizational growth, restructuring, or cost-cutting measures.

Analyze sentiment scores from Reddit discussions to understand retail investor mood and potential price momentum.

Track daily news mentions across major publications to measure media attention, PR effectiveness, and market awareness.

View key financial metrics including Revenue, Net Income, EPS, Free Cash Flow, EBITDA, and Total Assets. Access 2-year quarterly charts for Revenue & Income and Free Cash Flow trends.

Analyze technical indicators including 50-day Simple Moving Average (SMA) with price overlay and Relative Strength Index (RSI) charts.
TrendEdge provides tools and data for research and educational purposes only and does not provide investment advice or personal recommendations.
You don't hold RS in your mock portfolio yet.
With EPS of 13.74 and a PE ratio of 23.45, Reliance Steel & Aluminum appears reasonably profitable but not obviously undervalued, suggesting the market is already pricing in steady earnings. The valuation multiple is moderate for an industrial/metal distributor, implying expectations of stable, not explosive, growth. Overall, the financial picture looks solid but not clearly mispriced in either direction based on the limited data provided.
The stock is trading at $322.24, about 10% above its 200-day moving average of $292.96, which is generally constructive and reflects a positive medium-term trend. However, the RSI at 34.50 is close to oversold territory, indicating recent selling pressure or consolidation after a 9.1% gain over the last month. Together, these signals point to a stock that is in a longer-term uptrend but may be experiencing short-term fatigue or a cooling-off period.
Alternative data for Reliance Steel & Aluminum appears weak: web traffic is very low, there are no current job openings, and social media followings are small with flat to slightly negative trends on Twitter/X and Facebook. LinkedIn followers are modestly growing, which is a mild positive for professional brand presence, but not strong enough to offset the broader lack of digital engagement or expansion signals. Overall, these indicators suggest limited growth momentum or customer-facing engagement from a digital and hiring standpoint.
Reliance Steel & Aluminum shows solid profitability and a stock price that remains above its 200-day moving average, but the valuation appears fair rather than compelling and technicals suggest a pause after recent gains. Alternative data signals are generally soft, with low web traffic, no hiring, and weak social media traction, hinting at limited visible growth momentum. Taken together, the evidence supports a neutral outlook: the stock does not appear clearly mispriced to the upside or downside based on the information provided.
Our AI Score rates companies on a scale from 0 to 10, based on alternative data points such as web traffic, app downloads, and job postings — combined with financial health indicators and technical signals.
Key moves vs recent baseline (last day / last week)
Plain-English summary of the biggest drivers (informational)
Potential risk factors to review
Based on earnings timing, volatility, liquidity and crowd activity. Informational signals only — not investment advice.
Reassess your thesis if any of these occur: