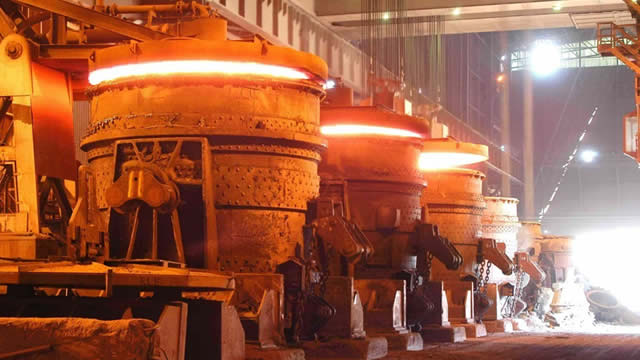
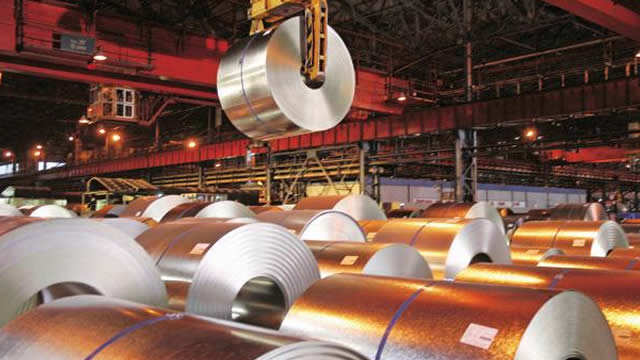
Cleveland-Cliffs: A Bet On 2026 Recovery I Am Not Willing To Take
CLF • NYSE
Unlock comprehensive alternative data signals to make better investment decisions

Track website visits, page views, unique visitors, and engagement metrics over time to gauge online interest and brand strength.

Monitor Twitter follower growth, engagement rates, and social media presence to understand brand reach and community sentiment.

Analyze TikTok follower trends and viral content performance to measure youth demographic appeal and cultural relevance.

Track Facebook page likes, comments, shares, and post engagement to assess community interaction and brand loyalty.

Monitor Instagram follower growth, engagement rates, and visual content performance across demographics.

Track YouTube channel growth, video views, and subscriber engagement to measure content marketing effectiveness.

Monitor LinkedIn company page followers and professional network growth to assess B2B brand strength and talent attraction.

Track open job positions and hiring trends as a leading indicator of company expansion, contraction, or strategic shifts.

Monitor employee headcount changes on LinkedIn to gauge organizational growth, restructuring, or cost-cutting measures.

Analyze sentiment scores from Reddit discussions to understand retail investor mood and potential price momentum.

Track daily news mentions across major publications to measure media attention, PR effectiveness, and market awareness.

View key financial metrics including Revenue, Net Income, EPS, Free Cash Flow, EBITDA, and Total Assets. Access 2-year quarterly charts for Revenue & Income and Free Cash Flow trends.

Analyze technical indicators including 50-day Simple Moving Average (SMA) with price overlay and Relative Strength Index (RSI) charts.
TrendEdge provides tools and data for research and educational purposes only and does not provide investment advice or personal recommendations.
You don't hold CLF in your mock portfolio yet.
Negative EPS and a negative PE ratio indicate that Cleveland-Cliffs is currently unprofitable, which weighs on the financial outlook despite any recent operational improvements that may not yet be visible in earnings. The lack of positive net income suggests pressure on profitability ratios and limits valuation support from fundamentals in the near term.
The stock has risen 6.4% over the last month and trades well above its 200-day moving average, indicating a constructive intermediate trend. However, an RSI of 46.25 is neutral, suggesting neither overbought nor oversold conditions and pointing to a consolidating rather than strongly trending setup.
Alternative data points suggest improving business activity and engagement: job openings are up sharply month over month, and LinkedIn followers are trending higher. While web traffic is modest in absolute terms, the hiring and social media trends are more indicative of management confidence and a stable or expanding operating footprint.
Overall, the picture is mixed: technicals and alternative data lean constructive, but current financial performance is weak due to negative earnings. The stock appears to be in a recovery phase where expectations for improvement are building, yet not fully confirmed by profitability metrics.
Our AI Score rates companies on a scale from 0 to 10, based on alternative data points such as web traffic, app downloads, and job postings — combined with financial health indicators and technical signals.
Key moves vs recent baseline (last day / last week)
Plain-English summary of the biggest drivers (informational)
Potential risk factors to review
Based on earnings timing, volatility, liquidity and crowd activity. Informational signals only — not investment advice.
Reassess your thesis if any of these occur: