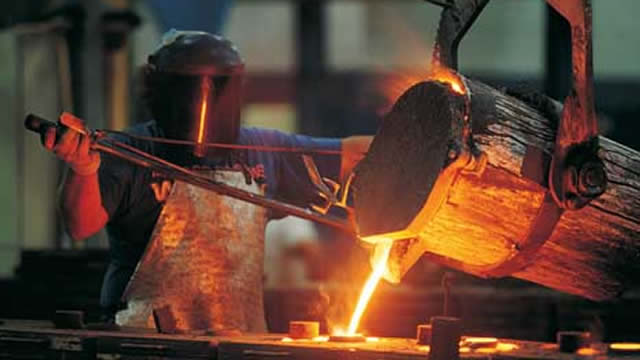
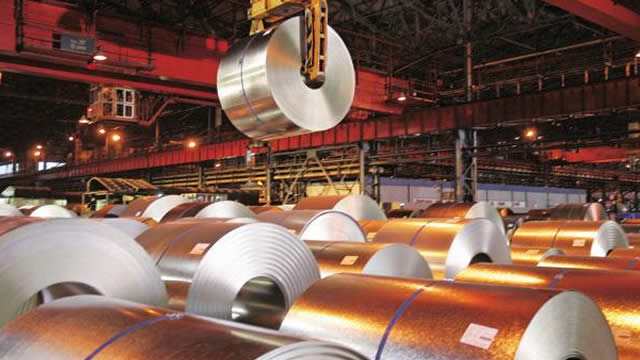
Commercial Metals Company (CMC) is currently trading at $72.36 on the NYSE, reflecting a 1.2% decline in the latest session on volume of approximately 1.05 million shares. With a market capitalization of $8.0 billion, CMC remains one of the more substantial players in the U.S. steel and metals recycling space. The company's vertically integrated model — spanning scrap metal processing, steel manufacturing, and downstream fabrication across the U.S., Poland, and China — provides structural diversification, though that hasn't insulated the stock from recent selling pressure.
TrendEdge's AI model assigns CMC a score of 5 out of 10, placing it squarely in neutral territory. This mid-range score suggests a balance of offsetting signals: the company's diversified operations and active hiring footprint of 350 open positions indicate operational continuity, while the absence of strong positive momentum — evidenced by the 1.2% single-day decline and limited social traction with only 6 Reddit mentions — keeps bullish conviction contained. The AI score reflects neither a clear accumulation signal nor a deterioration pattern, pointing to a wait-and-see posture rather than a directional trade.
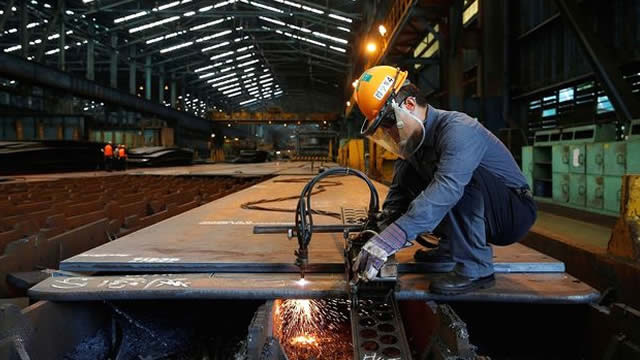
Investors monitoring CMC in 2026 should watch steel demand trends tied to U.S. infrastructure spending and construction activity, which directly influence rebar and merchant bar volumes. Scrap metal input costs and global steel pricing remain key margin variables. The company's Poland and China exposure introduces currency and geopolitical risk. With 350 active job postings, operational scaling appears ongoing, but whether that translates to earnings momentum will depend heavily on the macroeconomic backdrop for long steel products.