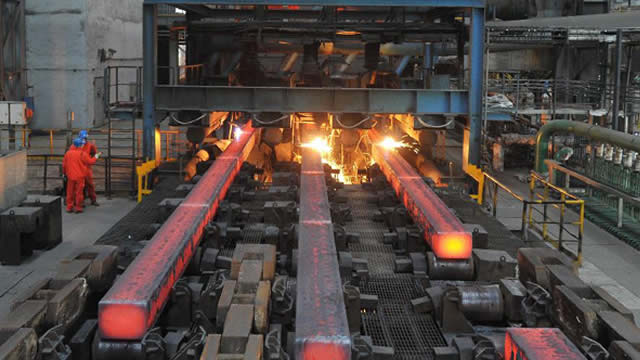
Nucor Corporation (NUE) is currently trading at $239.63 on the NYSE, following a single-session decline of -2.2% on volume of approximately 2.29 million shares. With a market capitalization of $54.6 billion, Nucor remains one of the largest steel producers in North America. The day's pullback reflects broader sector pressure rather than any company-specific breakdown, though it warrants attention for momentum traders. As the dominant U.S. electric arc furnace steelmaker, Nucor's pricing is tightly linked to domestic steel demand cycles, infrastructure spending, and raw material input costs.
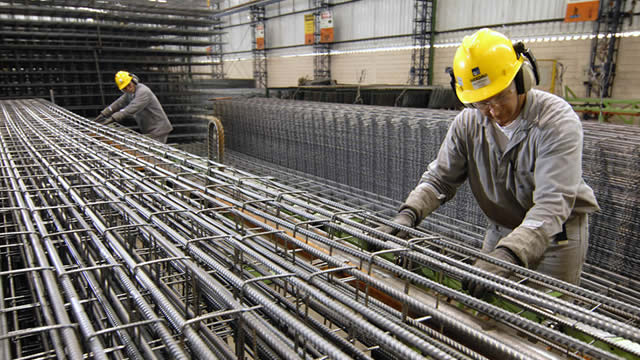
TrendEdge's AI model assigns Nucor a score of 7 out of 10, indicating a moderately bullish outlook supported by a mix of fundamental strength and operational signals. With 323 active job postings, the company is signaling continued investment in workforce and capacity — a leading indicator of operational expansion. The AI score reflects Nucor's historically disciplined capital allocation, diversified steel product portfolio across sheet, plate, and bar segments, and its vertically integrated model. A score of 7/10 suggests the stock holds merit for medium-term positioning, though it stops short of a high-conviction buy signal at current price levels.
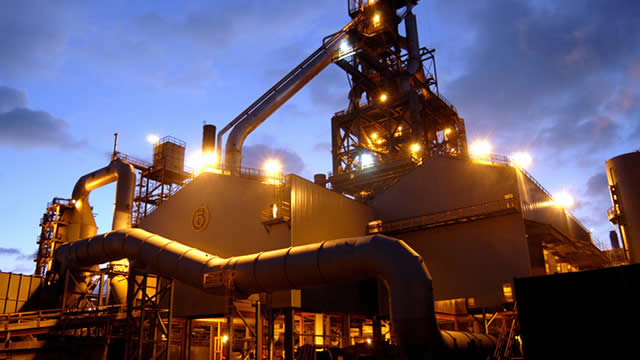
Key catalysts to monitor for NUE in 2026 include U.S. infrastructure bill disbursements driving structural steel demand, potential tariff adjustments on imported steel, and any shifts in non-residential construction activity. On the risk side, a slowdown in manufacturing output or softening scrap steel prices could compress margins. The -2.2% intraday move warrants watching for follow-through selling. Social sentiment data is currently limited, making price action and volume the primary short-term signals.