Micron Technology (MU) is trading at $1,051.77 on NASDAQ, posting a sharp single-day decline of 13.2% on volume of over 58 million shares — well above typical activity levels. The sell-off has drawn significant retail attention, with 1,627 Reddit mentions recorded over the past seven days. Despite the intraday drop, Micron's market capitalization holds at $1.2 trillion, reflecting its entrenched position as a global leader in DRAM, NAND, and NOR memory and storage semiconductors. The company's four business segments span compute, mobile, storage, and embedded markets, underscoring broad revenue diversification.
TrendEdge's AI model assigns Micron a score of 8 out of 10, indicating strong underlying signal strength even amid today's price volatility. The score is driven by a convergence of momentum indicators, elevated Reddit activity — up 77% versus the seven-day average — and proximity to the June 24, 2026 earnings date. Pre-earnings periods historically amplify both opportunity and risk in semiconductor names. The AI framework weighs these catalysts alongside Micron's 3,000 active job postings, which suggest continued operational expansion and R&D investment consistent with a company scaling aggressively into AI-driven memory demand.
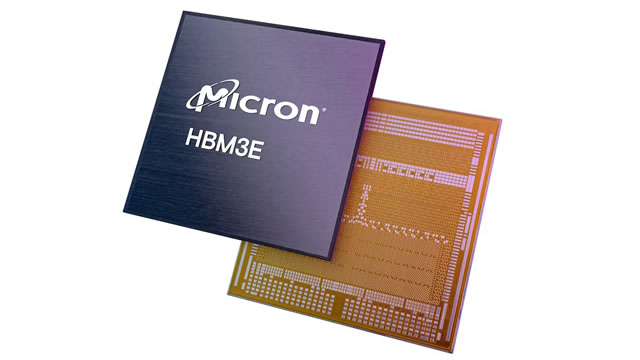
The June 24, 2026 earnings release is the primary near-term catalyst for MU. Investors should monitor guidance around HBM (High Bandwidth Memory) demand tied to AI infrastructure buildout, which has been a key revenue driver for Micron. The 13.2% single-day decline introduces elevated short-term volatility risk. Macro headwinds — including potential semiconductor export restrictions and cyclical memory pricing swings — remain structural risks. The 8/10 AI score suggests the signal environment remains constructive, but position sizing around the earnings date warrants careful consideration.