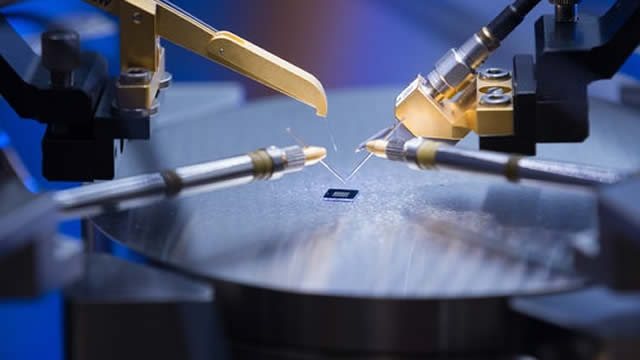
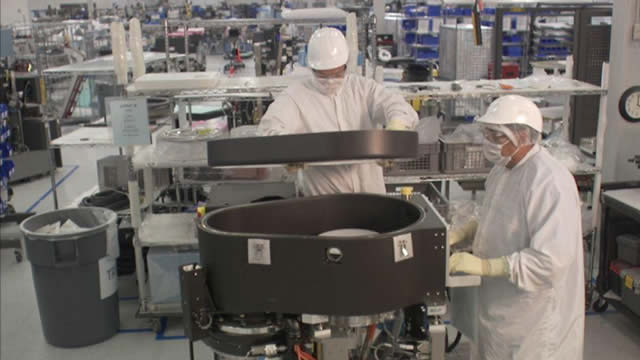
LRCX • NASDAQ
Unlock comprehensive alternative data signals to make better investment decisions

Track website visits, page views, unique visitors, and engagement metrics over time to gauge online interest and brand strength.

Monitor Twitter follower growth, engagement rates, and social media presence to understand brand reach and community sentiment.

Analyze TikTok follower trends and viral content performance to measure youth demographic appeal and cultural relevance.

Track Facebook page likes, comments, shares, and post engagement to assess community interaction and brand loyalty.

Monitor Instagram follower growth, engagement rates, and visual content performance across demographics.

Track YouTube channel growth, video views, and subscriber engagement to measure content marketing effectiveness.

Monitor LinkedIn company page followers and professional network growth to assess B2B brand strength and talent attraction.

Track open job positions and hiring trends as a leading indicator of company expansion, contraction, or strategic shifts.

Monitor employee headcount changes on LinkedIn to gauge organizational growth, restructuring, or cost-cutting measures.

Analyze sentiment scores from Reddit discussions to understand retail investor mood and potential price momentum.

Employee-reported business outlook and company culture scores from review platforms to assess internal morale and future prospects.

Track daily news mentions across major publications to measure media attention, PR effectiveness, and market awareness.

View key financial metrics including Revenue, Net Income, EPS, Free Cash Flow, EBITDA, and Total Assets. Access 2-year quarterly charts for Revenue & Income and Free Cash Flow trends.

Analyze technical indicators including 50-day Simple Moving Average (SMA) with price overlay and Relative Strength Index (RSI) charts.
TrendEdge provides AI-driven data and forecasts. Nothing here is investment advice or a recommendation to buy or sell any security. Capital is at risk.
© 2025 TrendEdge. All Rights Reserved.
Disclaimer: TrendEdge provides AI-driven data and forecasts. Nothing here is investment advice or a recommendation to buy or sell any security. Capital is at risk.
With a PE ratio of 35.45 and EPS of 4.53, Lam Research is being valued at a growth multiple that implies investors expect continued earnings expansion. However, without explicit revenue and margin trend data, the current valuation looks more dependent on forward growth expectations and the broader semiconductor cycle than on clearly accelerating fundamentals. Overall, the financial picture appears solid but not obviously cheap, suggesting a neutral stance based on valuation alone.
The stock is up 8.9% over the last month and trades well above its 200-day moving average of $105.99 at a current price of $160.57, indicating a strong longer-term uptrend. The RSI at 42.67 is below the overbought threshold, suggesting the recent advance has not yet pushed the stock into technically stretched territory. Overall, the technical setup leans bullish, with positive momentum and room for further upside before overbought conditions emerge.
Alternative data points show constructive underlying business and brand activity, particularly in hiring and professional engagement. Job openings at 482, up 37.7% month over month, indicate aggressive investment in capacity and talent, typically a positive signal for future demand and project pipeline. Social media trends are mixed on consumer-facing platforms but modestly positive on LinkedIn and YouTube, which matter more for a B2B, enterprise-focused company like Lam Research.
Lam Research’s stock exhibits a strong technical profile, trading significantly above its 200-day moving average with recent positive price momentum and a non-overbought RSI. While the valuation (PE of 35.45) implies high expectations and keeps the purely financial signal neutral, alternative data—especially sharply rising job postings and growing professional engagement—supports a constructive outlook on future business activity. Taken together, these factors tilt the overall view toward a bullish stance, with the main risk being that elevated expectations are already embedded in the share price.