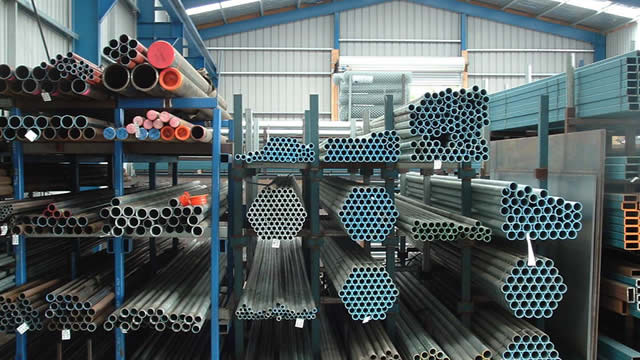
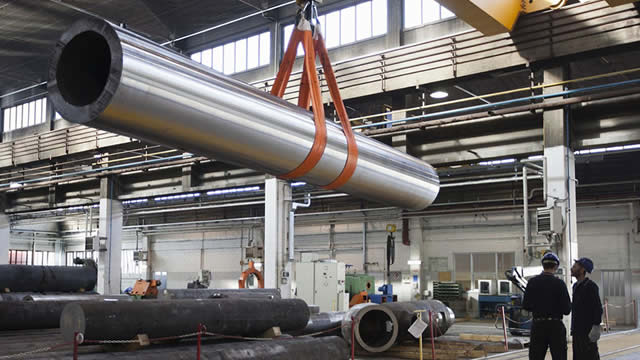
WOR • NYSE
Unlock comprehensive alternative data signals to make better investment decisions

Track website visits, page views, unique visitors, and engagement metrics over time to gauge online interest and brand strength.

Monitor Twitter follower growth, engagement rates, and social media presence to understand brand reach and community sentiment.

Analyze TikTok follower trends and viral content performance to measure youth demographic appeal and cultural relevance.

Track Facebook page likes, comments, shares, and post engagement to assess community interaction and brand loyalty.

Monitor Instagram follower growth, engagement rates, and visual content performance across demographics.

Track YouTube channel growth, video views, and subscriber engagement to measure content marketing effectiveness.

Monitor LinkedIn company page followers and professional network growth to assess B2B brand strength and talent attraction.

Track open job positions and hiring trends as a leading indicator of company expansion, contraction, or strategic shifts.

Monitor employee headcount changes on LinkedIn to gauge organizational growth, restructuring, or cost-cutting measures.

Analyze sentiment scores from Reddit discussions to understand retail investor mood and potential price momentum.

Track daily news mentions across major publications to measure media attention, PR effectiveness, and market awareness.

View key financial metrics including Revenue, Net Income, EPS, Free Cash Flow, EBITDA, and Total Assets. Access 2-year quarterly charts for Revenue & Income and Free Cash Flow trends.

Analyze technical indicators including 50-day Simple Moving Average (SMA) with price overlay and Relative Strength Index (RSI) charts.
TrendEdge provides tools and data for research and educational purposes only and does not provide investment advice or personal recommendations.
You don't hold WOR in your mock portfolio yet.
The combination of a very high P/E ratio and low EPS suggests the stock price is rich relative to current earnings power. Unless there is a credible and visible earnings growth trajectory, this valuation looks stretched and vulnerable to disappointment. Profitability appears thin relative to the market’s implied expectations.
The stock has declined 6.5% over the last month and trades below its 200-day moving average, indicating a weak intermediate trend. An RSI near 34 suggests the stock is approaching oversold territory, but not yet showing a clear reversal signal. Overall, technicals point to a pressured name with downside momentum still present.
Alternative data is mixed and relatively muted in magnitude. Web traffic is flat, suggesting no meaningful recent acceleration in customer or stakeholder interest. Hiring has declined notably, which can signal caution on growth, while social media followership is largely stable with only modest growth on some platforms.
Overall, the setup for Worthington Enterprises appears bearish. A very elevated valuation multiple, weak technical trend, and lack of strong positive alternative data catalysts create an unfavorable risk/reward profile. Without clear evidence of accelerating earnings growth or a technical reversal, the stock looks vulnerable to further downside or prolonged underperformance.
Our AI Score rates companies on a scale from 0 to 10, based on alternative data points such as web traffic, app downloads, and job postings — combined with financial health indicators and technical signals.
Key moves vs recent baseline (last day / last week)
Plain-English summary of the biggest drivers (informational)
Potential risk factors to review
Based on earnings timing, volatility, liquidity and crowd activity. Informational signals only — not investment advice.
Reassess your thesis if any of these occur: