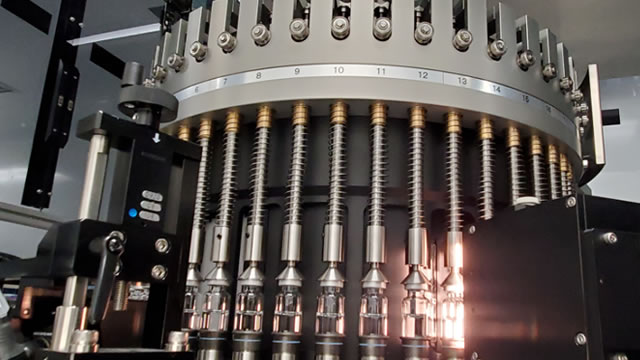
Merck & Co. (MRK) is currently trading at $115.49 on the NYSE, posting a modest +0.3% gain in the latest session with intraday volume of 6.87 million shares. The company carries a substantial market capitalization of $285.2 billion, cementing its position as one of the largest pharmaceutical enterprises globally. Merck operates across two core segments — Pharmaceutical and Animal Health — with its pharmaceutical division anchoring revenue through oncology, immunology, virology, cardiovascular, and vaccine franchises. The Animal Health segment adds diversification through veterinary pharmaceuticals and digital health management solutions.
TrendEdge's AI model assigns MRK a score of 7 out of 10, reflecting a constructive but measured outlook. A score at this level typically signals positive underlying fundamentals with some identifiable risk factors tempering a higher conviction rating. With 453 active job postings, Merck is demonstrating meaningful operational investment — a forward-looking indicator suggesting continued R&D and commercial expansion efforts. The AI model weighs hiring activity as a proxy for pipeline confidence and organizational momentum. Social sentiment data remains limited at this time, with only one Reddit mention tracked over the past seven days, meaning crowd-driven signals are currently a neutral factor in the score.
Looking ahead in 2026, Merck's key catalyst remains its oncology portfolio, particularly the sustained commercial trajectory of its flagship assets and late-stage pipeline readouts. Patent cliff dynamics and pipeline diversification are critical variables investors should monitor. The Animal Health segment offers a cushion against pharmaceutical-specific volatility. With 453 open roles signaling active investment in human capital, execution on pipeline and commercial milestones will be the primary driver of price re-rating. Any regulatory decisions or clinical trial outcomes should be treated as high-impact events for near-term price movement.