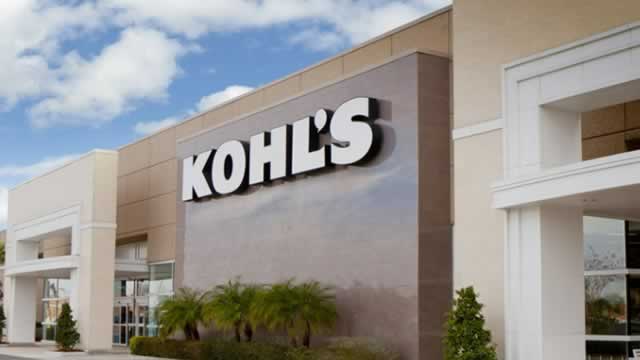
Kohl's Corporation (KSS) posted a notable 7.9% single-session price jump, pushing shares to $18.91 with volume of over 5.7 million shares — well above typical activity levels. Despite that short-term pop, the stock carries a market capitalization of just $2.1 billion, reflecting how far the department store chain has declined from its prior valuations. The one-day spike may reflect short-covering or a specific catalyst, but it has not materially altered the bearish structural backdrop that has weighed on KSS throughout this period.
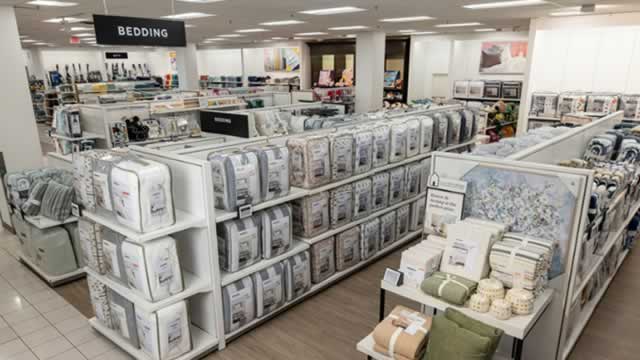
TrendEdge's AI model assigns KSS a score of 3 out of 10, placing it firmly in bearish territory. This low rating reflects a combination of deteriorating fundamentals, weak sector positioning, and limited momentum signals strong enough to sustain a recovery. Department stores as a category face relentless pressure from e-commerce competition and shifting consumer spending patterns, and Kohl's — operating approximately 1,100 physical locations — carries significant fixed-cost exposure. The AI score suggests the 7.9% daily move is unlikely to represent a durable trend reversal without meaningful fundamental improvement.
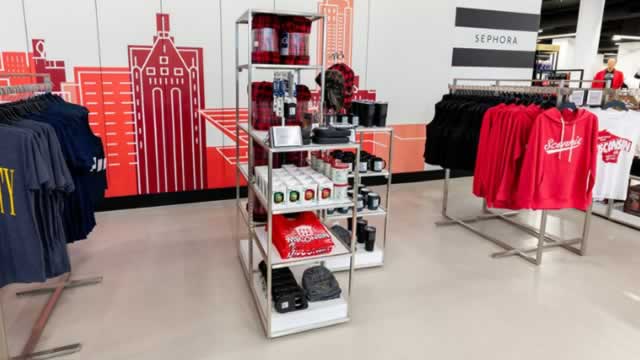
Looking ahead, investors should watch for any strategic announcements around Kohl's store footprint, cost structure, or brand partnership pipeline — areas where the company has historically tried to differentiate. Key risks include continued same-store sales deterioration, consumer spending softness, and balance sheet constraints at a $2.1B market cap. A sustained rise above current price levels with conviction would require the AI score to recover toward the 6–7 range. Until then, the data supports a cautious stance.