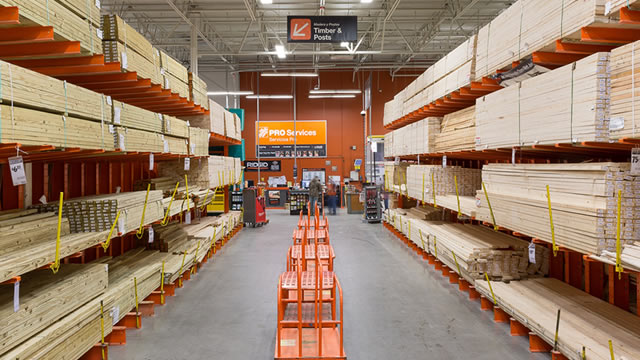
HD • NYSE
Unlock comprehensive alternative data signals to make better investment decisions

Track website visits, page views, unique visitors, and engagement metrics over time to gauge online interest and brand strength.

Monitor Twitter follower growth, engagement rates, and social media presence to understand brand reach and community sentiment.

Analyze TikTok follower trends and viral content performance to measure youth demographic appeal and cultural relevance.

Track Facebook page likes, comments, shares, and post engagement to assess community interaction and brand loyalty.

Monitor Instagram follower growth, engagement rates, and visual content performance across demographics.

Track YouTube channel growth, video views, and subscriber engagement to measure content marketing effectiveness.

Monitor LinkedIn company page followers and professional network growth to assess B2B brand strength and talent attraction.

Track open job positions and hiring trends as a leading indicator of company expansion, contraction, or strategic shifts.

Monitor employee headcount changes on LinkedIn to gauge organizational growth, restructuring, or cost-cutting measures.

Analyze sentiment scores from Reddit discussions to understand retail investor mood and potential price momentum.

Track daily news mentions across major publications to measure media attention, PR effectiveness, and market awareness.

View key financial metrics including Revenue, Net Income, EPS, Free Cash Flow, EBITDA, and Total Assets. Access 2-year quarterly charts for Revenue & Income and Free Cash Flow trends.

Analyze technical indicators including 50-day Simple Moving Average (SMA) with price overlay and Relative Strength Index (RSI) charts.
TrendEdge provides tools and data for research and educational purposes only and does not provide investment advice or personal recommendations.
You don't hold HD in your mock portfolio yet.
With a PE ratio of 23.49 and EPS of 14.65, Home Depot is priced at a modest premium to the broader market but in line with a high‑quality, mature retailer. These metrics suggest solid, stable profitability rather than high‑growth dynamics. Valuation appears reasonable but not clearly discounted, which tempers the upside case in the absence of strong growth acceleration.
The stock trades at $344.10, about 7.8% below its 200‑day moving average of $373.13, after a modest 3% pullback over the last month. An RSI of 12.94 is extremely oversold by technical standards, often associated with capitulation or short‑term selling exhaustion. Together, these indicators suggest elevated odds of a technical rebound or at least stabilization, assuming no major negative fundamental surprises.
Website traffic is flat month over month at a very high level, while app downloads are down 14.2% MoM, hinting at some softening in mobile engagement. Job openings are flat at 24,000, suggesting neither aggressive expansion nor contraction. Social media followings are broadly stable to slightly rising, pointing to steady brand engagement but not a major inflection in consumer interest.
Home Depot’s fundamentals and alternative data point to a stable, mature business with solid earnings but no clear sign of accelerating growth in the near term. However, the stock’s extremely oversold RSI and discount to its 200‑day moving average create a constructive technical backdrop that could support a rebound if macro and housing trends do not deteriorate significantly. Overall, the balance of steady fundamentals and oversold technicals leads to a neutral stance with a bias toward a technical recovery rather than a deep fundamental breakdown.
Our AI Score rates companies on a scale from 0 to 10, based on alternative data points such as web traffic, app downloads, and job postings — combined with financial health indicators and technical signals.
Key moves vs recent baseline (last day / last week)
Plain-English summary of the biggest drivers (informational)
Potential risk factors to review
Based on earnings timing, volatility, liquidity and crowd activity. Informational signals only — not investment advice.
Reassess your thesis if any of these occur: