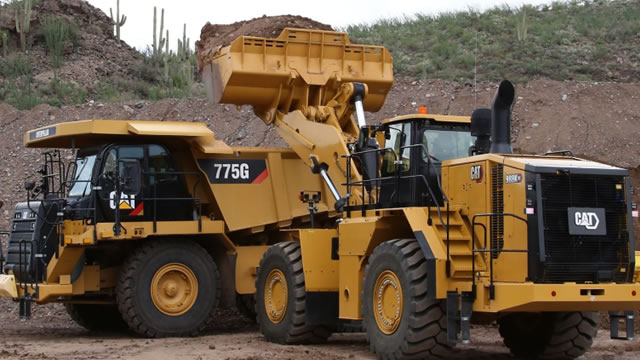
CAT • NYSE
Unlock comprehensive alternative data signals to make better investment decisions

Track website visits, page views, unique visitors, and engagement metrics over time to gauge online interest and brand strength.

Monitor Twitter follower growth, engagement rates, and social media presence to understand brand reach and community sentiment.

Analyze TikTok follower trends and viral content performance to measure youth demographic appeal and cultural relevance.

Track Facebook page likes, comments, shares, and post engagement to assess community interaction and brand loyalty.

Monitor Instagram follower growth, engagement rates, and visual content performance across demographics.

Track YouTube channel growth, video views, and subscriber engagement to measure content marketing effectiveness.

Monitor LinkedIn company page followers and professional network growth to assess B2B brand strength and talent attraction.

Track open job positions and hiring trends as a leading indicator of company expansion, contraction, or strategic shifts.

Monitor employee headcount changes on LinkedIn to gauge organizational growth, restructuring, or cost-cutting measures.

Analyze sentiment scores from Reddit discussions to understand retail investor mood and potential price momentum.

Track daily news mentions across major publications to measure media attention, PR effectiveness, and market awareness.

View key financial metrics including Revenue, Net Income, EPS, Free Cash Flow, EBITDA, and Total Assets. Access 2-year quarterly charts for Revenue & Income and Free Cash Flow trends.

Analyze technical indicators including 50-day Simple Moving Average (SMA) with price overlay and Relative Strength Index (RSI) charts.
TrendEdge provides tools and data for research and educational purposes only and does not provide investment advice or personal recommendations.
You don't hold CAT in your mock portfolio yet.
The current valuation (PE ~33 on EPS of 19.49) implies strong earnings and a premium multiple versus Caterpillar’s historical norms, but without additional revenue and margin trend data it is hard to justify a clearly bullish or bearish stance. The market is pricing in continued solid profitability and cyclical resilience, leaving less margin of safety if growth slows.
The stock has had a strong short-term move, up 12.3% in the last month, and trades well above its 200-day moving average, indicating a solid intermediate uptrend. However, an RSI around 51.5 shows momentum has cooled to a more balanced level, suggesting neither overbought nor oversold conditions after the run.
Hiring and digital engagement metrics point to a company that is investing for growth and maintaining a stable brand presence. The 14.9% month-over-month increase in job openings is particularly notable as a forward-looking indicator of demand and expansion.
Caterpillar’s stock reflects strong recent performance, a solid uptrend, and constructive alternative data, but the elevated valuation tempers the outlook. The setup appears balanced: upside depends on sustained earnings growth and cyclical strength, while the premium multiple increases sensitivity to any slowdown.
Our AI Score rates companies on a scale from 0 to 10, based on alternative data points such as web traffic, app downloads, and job postings — combined with financial health indicators and technical signals.
Key moves vs recent baseline (last day / last week)
Plain-English summary of the biggest drivers (informational)
Potential risk factors to review
Based on earnings timing, volatility, liquidity and crowd activity. Informational signals only — not investment advice.
Reassess your thesis if any of these occur: