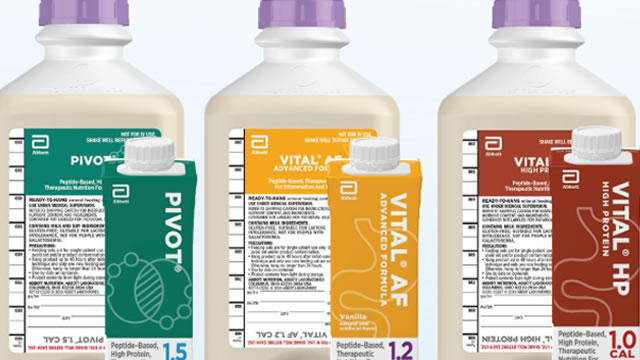
Abbott Laboratories (ABT) is currently trading at $85.58 on the NYSE, down 0.8% in the latest session, against a market capitalization of $149.1B. Daily volume of approximately 7.9 million shares reflects steady institutional interest in one of the largest diversified healthcare companies in the world. Abbott's four-segment structure — spanning Medical Devices, Diagnostics, Nutritional Products, and Established Pharmaceuticals — provides revenue diversification, but that breadth also makes the stock sensitive to sector-level headwinds across multiple fronts simultaneously. The current price reflects a market weighing near-term margin pressures against Abbott's durable long-term positioning.
TrendEdge's AI model assigns Abbott Laboratories a score of 5 out of 10 — a neutral reading that signals neither a strong buy nor a clear sell at current levels. This midpoint score reflects a balance of factors: Abbott's scale and multi-segment diversification provide stability, but momentum indicators are muted and social sentiment data remains sparse, with only 5 Reddit mentions in the past seven days offering little directional conviction from retail participants. The 2,000 active job postings suggest the company is maintaining operational investment, which could indicate pipeline development or expansion activity, though it does not yet translate into a bullish AI signal on its own.
Looking ahead in 2026, Abbott's Medical Devices segment — particularly its cardiovascular and continuous glucose monitoring franchises — remains the key catalyst to watch. Regulatory decisions, competitive dynamics in the CGM market, and any volume recovery in elective procedures could shift sentiment meaningfully. On the risk side, currency headwinds given Abbott's global footprint and litigation exposure warrant monitoring. A move in the AI score above 6 or below 4 would signal a material shift in the underlying data pattern.