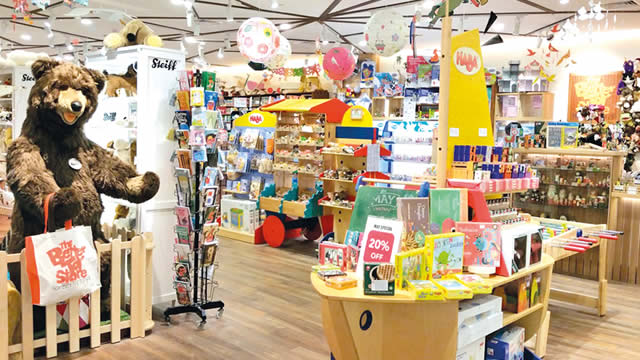
JAKK • NASDAQ
Unlock comprehensive alternative data signals to make better investment decisions

Track website visits, page views, unique visitors, and engagement metrics over time to gauge online interest and brand strength.

Monitor Twitter follower growth, engagement rates, and social media presence to understand brand reach and community sentiment.

Analyze TikTok follower trends and viral content performance to measure youth demographic appeal and cultural relevance.

Track Facebook page likes, comments, shares, and post engagement to assess community interaction and brand loyalty.

Monitor Instagram follower growth, engagement rates, and visual content performance across demographics.

Track YouTube channel growth, video views, and subscriber engagement to measure content marketing effectiveness.

Monitor LinkedIn company page followers and professional network growth to assess B2B brand strength and talent attraction.

Track open job positions and hiring trends as a leading indicator of company expansion, contraction, or strategic shifts.

Monitor employee headcount changes on LinkedIn to gauge organizational growth, restructuring, or cost-cutting measures.

Analyze sentiment scores from Reddit discussions to understand retail investor mood and potential price momentum.

Track daily news mentions across major publications to measure media attention, PR effectiveness, and market awareness.

View key financial metrics including Revenue, Net Income, EPS, Free Cash Flow, EBITDA, and Total Assets. Access 2-year quarterly charts for Revenue & Income and Free Cash Flow trends.

Analyze technical indicators including 50-day Simple Moving Average (SMA) with price overlay and Relative Strength Index (RSI) charts.
TrendEdge provides tools and data for research and educational purposes only and does not provide investment advice or personal recommendations.
You don't hold JAKK in your mock portfolio yet.
The combination of a high P/E ratio of 39.36 and modest EPS of 0.47 suggests the stock is priced for strong growth that is not clearly supported by the limited earnings data provided. Without evidence of accelerating revenue or margin expansion, current valuation appears stretched relative to earnings power. This skews the risk/reward profile to the downside unless fundamentals improve meaningfully.
Despite a 10.4% gain over the last month, the stock now trades slightly below its 200‑day moving average ($18.50 vs. $18.62), suggesting it has not convincingly broken into a sustained uptrend. The extremely low RSI of 22.77 indicates the stock is in oversold territory, reflecting recent selling pressure and weak momentum. Together, these signals point to a fragile technical setup with downside risk if buying interest does not return.
Alternative data for JAKKS Pacific is mixed and relatively muted. Web traffic at roughly 63k visitors per month is modest, and hiring activity is flat with zero job openings, implying no visible expansion push. Social media metrics are largely stable with slight growth on LinkedIn and a small decline on Twitter/X, suggesting neither strong positive nor strongly negative momentum in brand engagement.
Overall, the setup for JAKKS Pacific appears bearish. A high earnings multiple on modest EPS, combined with oversold technicals and a price sitting just below the 200‑day moving average, suggests vulnerability if growth does not accelerate. Alternative data show stable but unexciting engagement and no clear signs of aggressive expansion, leaving limited support for the current valuation.


JAKKS Pacific, Inc. (JAKK) Q4 2025 Earnings Call Transcript


Jakks Pacific Reports Fourth Quarter and Full-Year 2025 Financial Results
Our AI Score rates companies on a scale from 0 to 10, based on alternative data points such as web traffic, app downloads, and job postings — combined with financial health indicators and technical signals.
Key moves vs recent baseline (last day / last week)
Plain-English summary of the biggest drivers (informational)
Potential risk factors to review
Based on earnings timing, volatility, liquidity and crowd activity. Informational signals only — not investment advice.
Reassess your thesis if any of these occur: