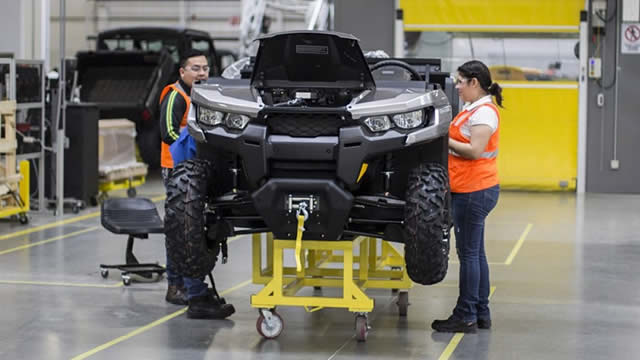
Comparing Fox Factory (NASDAQ:FOXF) & PACCAR (NASDAQ:PCAR)
FOXF • NASDAQ
Unlock comprehensive alternative data signals to make better investment decisions

Track website visits, page views, unique visitors, and engagement metrics over time to gauge online interest and brand strength.

Monitor Twitter follower growth, engagement rates, and social media presence to understand brand reach and community sentiment.

Analyze TikTok follower trends and viral content performance to measure youth demographic appeal and cultural relevance.

Track Facebook page likes, comments, shares, and post engagement to assess community interaction and brand loyalty.

Monitor Instagram follower growth, engagement rates, and visual content performance across demographics.

Track YouTube channel growth, video views, and subscriber engagement to measure content marketing effectiveness.

Monitor LinkedIn company page followers and professional network growth to assess B2B brand strength and talent attraction.

Track open job positions and hiring trends as a leading indicator of company expansion, contraction, or strategic shifts.

Monitor employee headcount changes on LinkedIn to gauge organizational growth, restructuring, or cost-cutting measures.

Analyze sentiment scores from Reddit discussions to understand retail investor mood and potential price momentum.

Track daily news mentions across major publications to measure media attention, PR effectiveness, and market awareness.

View key financial metrics including Revenue, Net Income, EPS, Free Cash Flow, EBITDA, and Total Assets. Access 2-year quarterly charts for Revenue & Income and Free Cash Flow trends.

Analyze technical indicators including 50-day Simple Moving Average (SMA) with price overlay and Relative Strength Index (RSI) charts.
TrendEdge provides tools and data for research and educational purposes only and does not provide investment advice or personal recommendations.
You don't hold FOXF in your mock portfolio yet.
Current valuation metrics and earnings data point to weak underlying financial performance. A negative EPS of -6.17 and a corresponding negative PE ratio of -3.13 indicate that the company is loss-making, with profitability under pressure. Until there is clear evidence of earnings stabilization or a path back to positive income, the financial picture leans negative.
The stock trades at $19.31, modestly down 0.7% over the last month, but below its 200-day moving average of $23.15, indicating a broader downtrend. However, the RSI at 21.08 is deeply oversold, which often precedes at least a short-term relief rally. Overall, technicals show a weak intermediate trend but a potential near-term rebound setup.
Alternative data are mixed: hiring activity is strong, while social media followings are largely flat to slightly down, and web traffic is stable at a moderate level. The 20% month-over-month increase in job openings suggests management is investing for growth or capacity, which is a constructive signal. Slight declines in major social channels and only modest growth in professional and video platforms point to a stable but not rapidly expanding demand or brand engagement backdrop.
Overall, the picture for Fox Factory Holding appears neutral with a tilt toward caution on fundamentals but some constructive signals in technicals and alternative data. Loss-making financials and a price below the 200-day moving average argue against a clearly bullish stance, yet deeply oversold RSI and rising hiring activity suggest potential for operational improvement and a technical rebound. Investors may view the stock as a potential turnaround or recovery candidate, but confirmation via improved earnings and sustained demand indicators is still needed.

Comparing Fox Factory (NASDAQ:FOXF) & PACCAR (NASDAQ:PCAR)


Fox Factory Holding Corp. (FOXF) Q3 2025 Earnings Call Transcript
Our AI Score rates companies on a scale from 0 to 10, based on alternative data points such as web traffic, app downloads, and job postings — combined with financial health indicators and technical signals.
Key moves vs recent baseline (last day / last week)
Plain-English summary of the biggest drivers (informational)
Potential risk factors to review
Based on earnings timing, volatility, liquidity and crowd activity. Informational signals only — not investment advice.
Reassess your thesis if any of these occur: