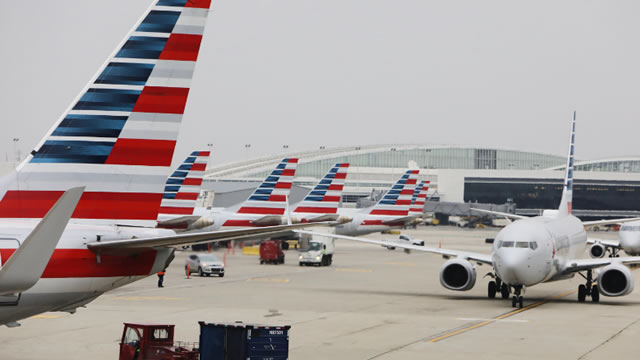
Anglo American shares on front foot as annual earnings rise
AAL • NASDAQ
Unlock comprehensive alternative data signals to make better investment decisions

Track website visits, page views, unique visitors, and engagement metrics over time to gauge online interest and brand strength.

Monitor Twitter follower growth, engagement rates, and social media presence to understand brand reach and community sentiment.

Analyze TikTok follower trends and viral content performance to measure youth demographic appeal and cultural relevance.

Track Facebook page likes, comments, shares, and post engagement to assess community interaction and brand loyalty.

Monitor Instagram follower growth, engagement rates, and visual content performance across demographics.

Track YouTube channel growth, video views, and subscriber engagement to measure content marketing effectiveness.

Monitor LinkedIn company page followers and professional network growth to assess B2B brand strength and talent attraction.

Track open job positions and hiring trends as a leading indicator of company expansion, contraction, or strategic shifts.

Monitor employee headcount changes on LinkedIn to gauge organizational growth, restructuring, or cost-cutting measures.

Analyze sentiment scores from Reddit discussions to understand retail investor mood and potential price momentum.

Track daily news mentions across major publications to measure media attention, PR effectiveness, and market awareness.

View key financial metrics including Revenue, Net Income, EPS, Free Cash Flow, EBITDA, and Total Assets. Access 2-year quarterly charts for Revenue & Income and Free Cash Flow trends.

Analyze technical indicators including 50-day Simple Moving Average (SMA) with price overlay and Relative Strength Index (RSI) charts.
TrendEdge provides tools and data for research and educational purposes only and does not provide investment advice or personal recommendations.
You don't hold AAL in your mock portfolio yet.
With EPS of 0.87 and a PE ratio of 18.2, American Airlines is generating positive earnings but not at a clearly discounted valuation given its cyclical and leveraged business model. The figures suggest modest profitability rather than strong earnings momentum, and without evidence of rapid EPS growth or margin expansion, the stock’s fundamental story appears balanced rather than compelling. Overall, the financial profile looks stable but not strongly improving based on the limited metrics provided.
The stock trades at $15.83, up 6.5% over the last month, indicating recent positive momentum. However, an RSI of 42.09 signals neither overbought nor oversold conditions, and the price sitting above a 200‑day moving average of $12.16 reflects a recovery trend that may already be partly priced in. Overall, the technical setup suggests a steady uptrend but not a strong near‑term inflection point.
Alternative data presents a mixed but slightly constructive picture: app downloads are surging, while web traffic is flat and job postings have dropped sharply. Social media followings are slowly growing across most platforms, suggesting stable brand engagement rather than breakout demand. The signals collectively point to steady demand and engagement, but not a clearly accelerating growth story.
Taken together, American Airlines’ current profitability, moderate valuation, constructive but not extreme technicals, and mixed alternative data support a neutral view on the stock. There are signs of operational stability and improving digital engagement, but not enough evidence of strong earnings acceleration or demand growth to justify a clearly bullish stance, nor clear deterioration to warrant a bearish outlook.

Anglo American shares on front foot as annual earnings rise


Teck Resources reports strong Q4 earnings, advances Anglo American merger
Our AI Score rates companies on a scale from 0 to 10, based on alternative data points such as web traffic, app downloads, and job postings — combined with financial health indicators and technical signals.
Key moves vs recent baseline (last day / last week)
Plain-English summary of the biggest drivers (informational)
Potential risk factors to review
Based on earnings timing, volatility, liquidity and crowd activity. Informational signals only — not investment advice.
Reassess your thesis if any of these occur: