Why Advisors Are Ditching Mutual Funds for Sector ETFs
. etftrends.com
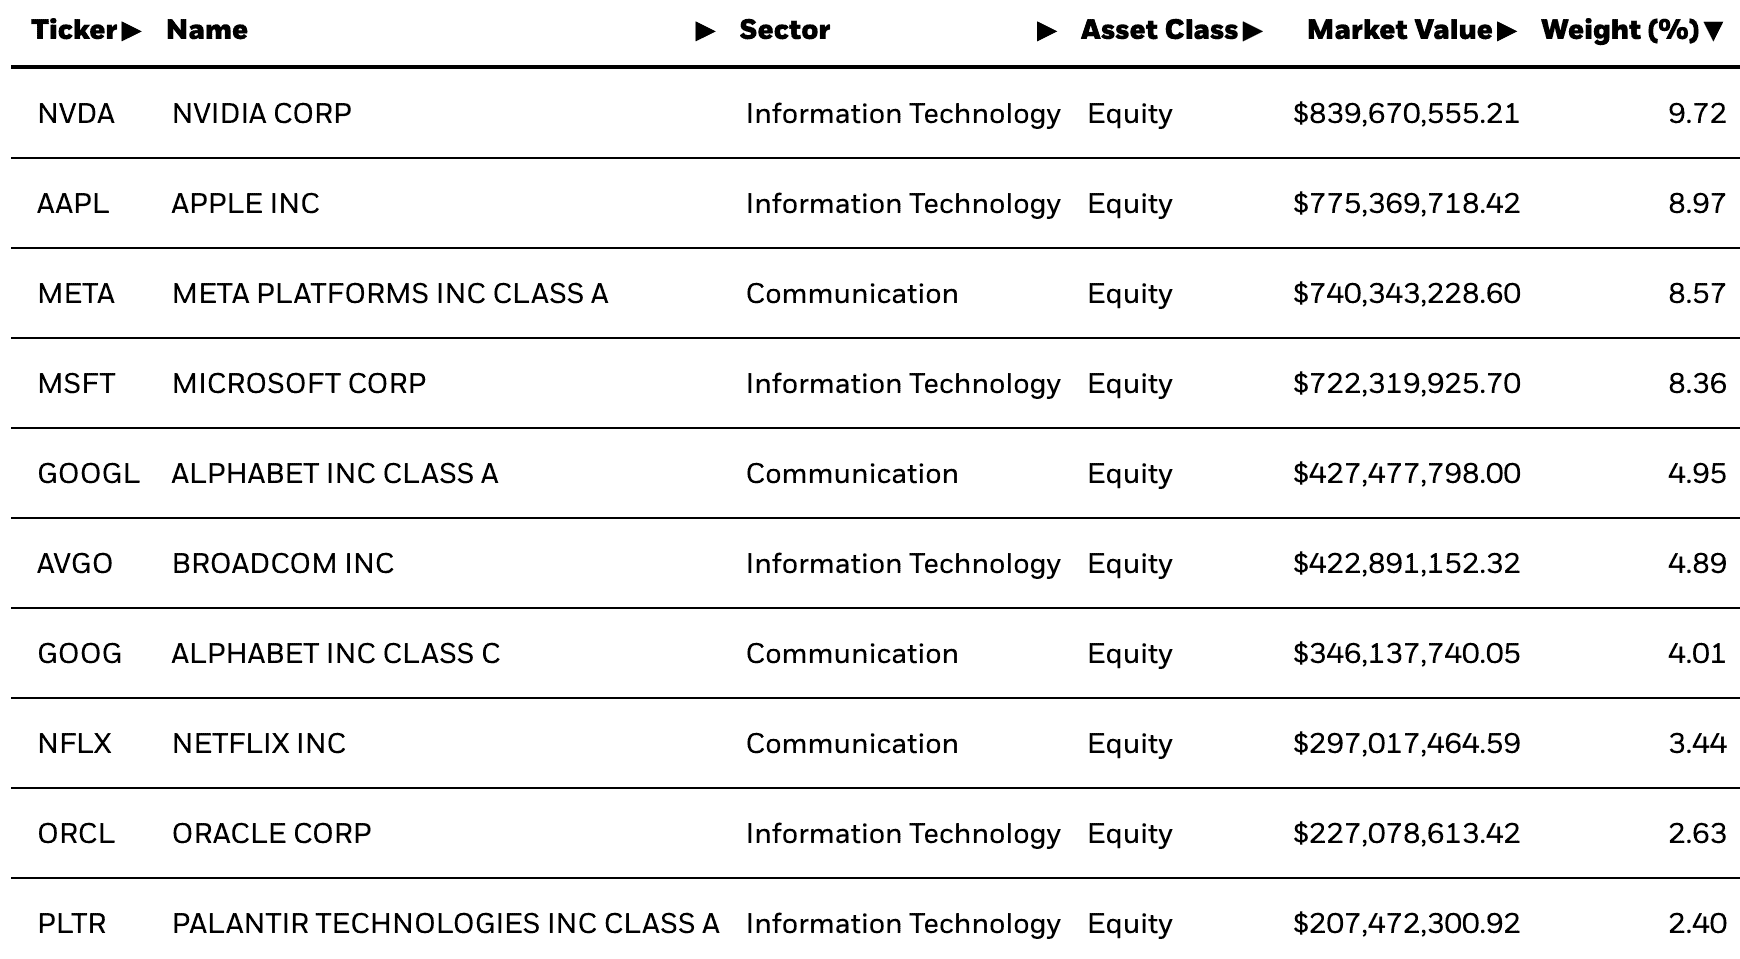
Technology Select Sector SPDR (XLK) • AMEX
Unlock comprehensive alternative data signals to make better investment decisions

Track website visits, page views, unique visitors, and engagement metrics over time to gauge online interest and brand strength.
Monitor Twitter follower growth, engagement rates, and social media presence to understand brand reach and community sentiment.
Analyze TikTok follower trends and viral content performance to measure youth demographic appeal and cultural relevance.
Track Facebook page likes, comments, shares, and post engagement to assess community interaction and brand loyalty.
Monitor Instagram follower growth, engagement rates, and visual content performance across demographics.
Track YouTube channel growth, video views, and subscriber engagement to measure content marketing effectiveness.
Monitor LinkedIn company page followers and professional network growth to assess B2B brand strength and talent attraction.
Track open job positions and hiring trends as a leading indicator of company expansion, contraction, or strategic shifts.
Monitor employee headcount changes on LinkedIn to gauge organizational growth, restructuring, or cost-cutting measures.
Analyze sentiment scores from Reddit discussions to understand retail investor mood and potential price momentum.
Track daily news mentions across major publications to measure media attention, PR effectiveness, and market awareness.
View key financial metrics including Revenue, Net Income, EPS, Free Cash Flow, EBITDA, and Total Assets. Access 2-year quarterly charts for Revenue & Income and Free Cash Flow trends.
Analyze technical indicators including 50-day Simple Moving Average (SMA) with price overlay and Relative Strength Index (RSI) charts.
TrendEdge provides tools and data for research and educational purposes only and does not provide investment advice or personal recommendations.
You don't hold XLK in your mock portfolio yet.
The ETF’s valuation profile (PE 38.15, EPS 5.02) implies investors are paying a growth premium for the underlying tech constituents, many of which are highly profitable but cyclical and rate‑sensitive. While the earnings base appears solid, the elevated multiple suggests much of the growth story is already priced in, leaving less margin for error if sector earnings disappoint.
With the stock at $191.44 versus a 200‑day moving average of $149.31, the ETF is trading well above long‑term trend, indicating a strong, established uptrend. The recent 6.1% gain over the last month reinforces positive momentum, though it also raises the risk of short‑term pullbacks or consolidation after a strong run.
Specific alternative data for this ETF (such as web traffic to the fund’s pages, social media engagement, or flows) is not provided, but macro signals for the tech sector remain broadly constructive. Market narratives around AI, cloud, and digital transformation continue to drive strong investor interest, yet this enthusiasm is widely known and likely already embedded in prices.
The Technology Select Sector SPDR is in a strong technical uptrend and commands a premium valuation that reflects sustained optimism about the tech sector’s earnings power. While the elevated PE and extended distance above the 200‑day moving average argue for caution about volatility and pullbacks, the prevailing trend and sector narrative remain supportive, skewing the outlook modestly bullish.
Our AI Score rates companies on a scale from 0 to 10, based on alternative data points such as web traffic, app downloads, and job postings — combined with financial health indicators and technical signals.
Upgrade to see the full Evidence Stack
What Changed, Why Now, and Risk Flags — available on the Investor plan and above
Get Started